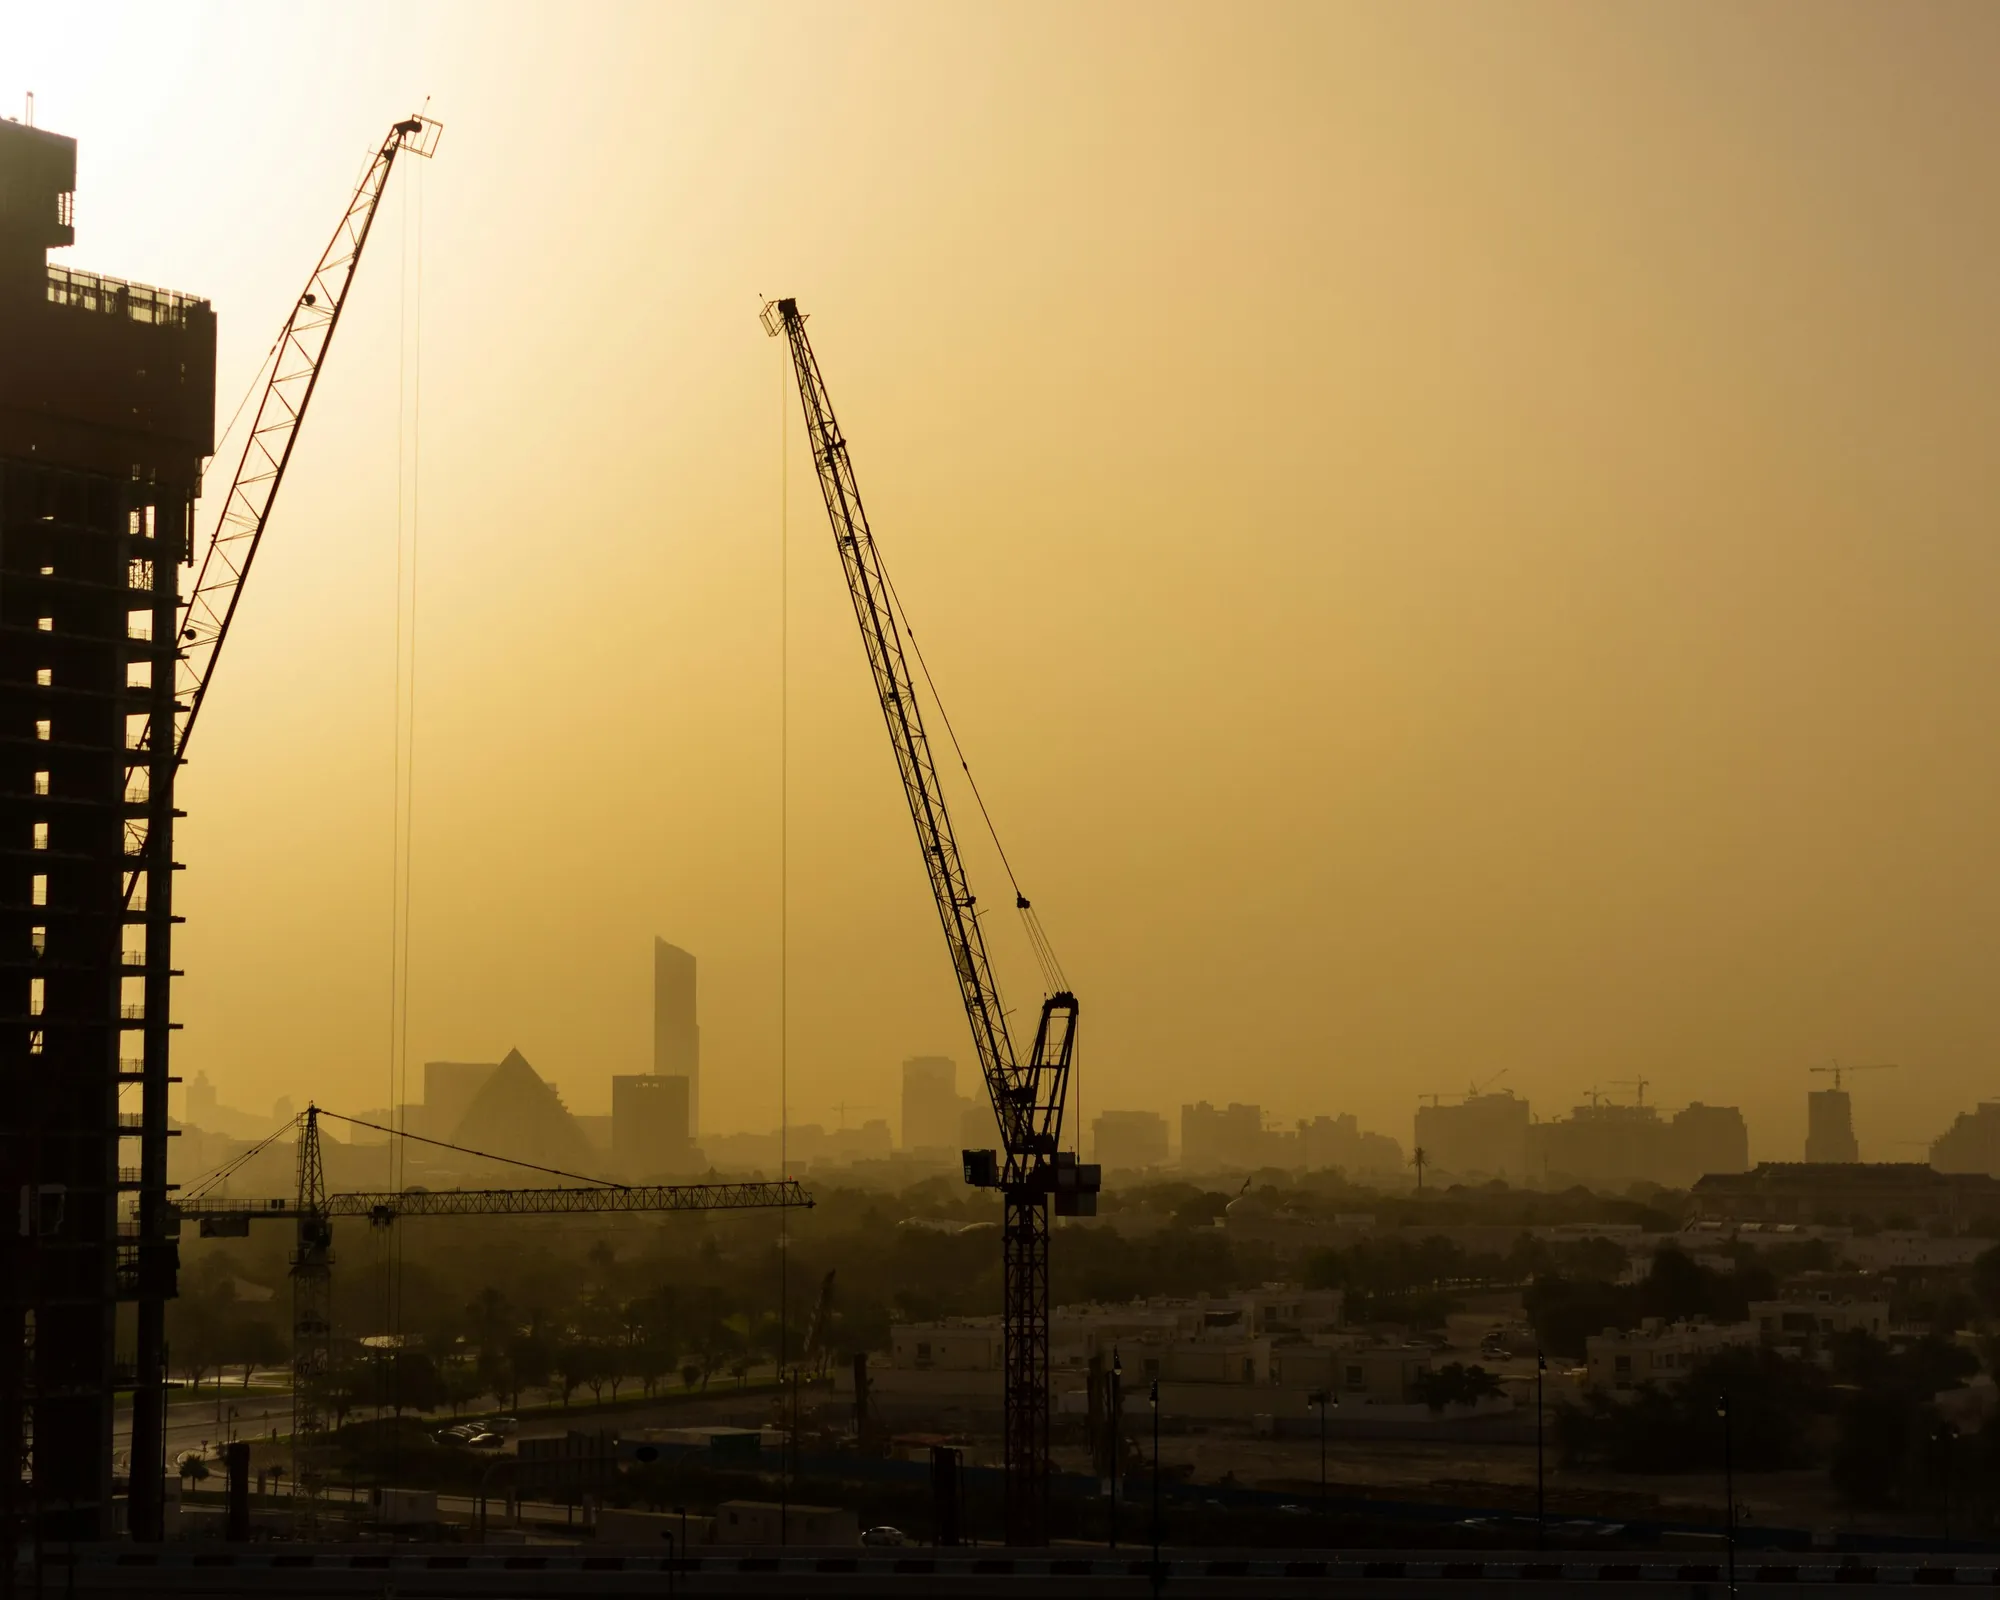
Everyone quotes the pipeline. Almost nobody adjusts for the fact that most of it slips. Here is Dubai's supply, honestly: what is planned, what is under construction, what actually got delivered, and where.
The whole market
Every figure in this section covers all property types, apartments and villas together, straight from registered DLD supply data.
Launched, planned and completed, per year
The whole supply cycle in one picture, every bar a full calendar year. Launched is new homes put on sale that year, the pipeline filling up. Planned is homes that were due to hand over that year. Completed is how many of those planned homes actually handed over. The gap between planned and completed is slippage: homes still under construction or overdue. Filter by area, property type or bedrooms to see where delivery runs on time and where it stalls.
Future pipeline by handover year
Properties registered to hand over in each year ahead. History says only a minority lands on time, so read it as a ceiling, not a forecast. Pick an area to see just its pipeline.
How far along is what's building
Properties under construction, grouped by how complete they are. A pile of properties still under 20% built is a pile that can still slip for years.
Top areas by future supply
Properties registered to hand over within the selected window, by area. Future dates slip, so read even the near windows as a ceiling. Switch to All for the total registered pipeline.
Top areas by handovers
Properties handed over (completed) in the selected period, by area. Pick any year back to 2016, or the current year so far (year to date). A wave of handovers usually brings fresh resale and rental listings to an area.
What is being built, by size
Home mix by bedroom count. Grey is what has already been delivered; copper is the future pipeline. Dubai's pipeline leans heavily on studios and one-beds, the classic investor buy. Pick an area to see its own mix.
Biggest pipeline developers
Who is building the most in the future pipeline, ranked by properties registered to hand over. The sub-line shows how much each has already delivered. Pick an area to see who is building there.
Latest handovers
Every delivered project on record, newest handover first. Scroll for the full history. Pick an area to see only its handovers.
Where the villa & townhouse supply is
Villa and townhouse projects could not be pulled one by one, so this ranks communities by their villa and townhouse sales activity, a strong proxy for where that supply sits. The share tells you how villa-dominated each community is.
Supply projects explorer
Every project in the supply file, 5,838 across all types, apartments, villas and townhouses. Filter by area, property type, developer, handover year and status, then read the breakdowns and the full list below. Property type is read from the Land Department's own transaction records for each project, so a small share of brand-new launches that have not registered a sale yet show as Unknown. Townhouses sit inside Villa, the same way the sales records group them. Tap any project for its bedroom breakdown. Area names are the Land Department's own sub-community names, so numbered ones like Al Barsha South 2, 3 and 4 are genuinely separate districts, not duplicates.
Properties by area
Total properties in the matched projects, by area (top 15).
Properties by developer
Which developers hold the most properties in this slice (top 15).
Properties by handover year
When the matched properties completed or are registered to complete.
Homes by bedroom
Bedroom mix of the matched projects. Villa-heavy slices skew to the larger sizes.
Every matched supply project
Tap a column header to sort, tap a row for its bedroom breakdown. Status is delivered, future pipeline, or announced (no completion date set yet).
Loading…
Supply is half the story.
Knowing what is coming to your area, and when it really lands, is the difference between buying into a glut and buying ahead of one. That is the kind of read I give clients.